

Wages versus rent: the economics that created our modern housing market
Which year ended the American Dream: 1973, 1982, 1999 or 2008?

In the USA, asset prices fell dramatically from 1966 to 1982. The Dow Jones fell, in nominal terms, from 1,100 to 800, which doesn’t sound too bad till you remember the 1970s saw double digit inflation, and so adjusting for inflation the crash was 80%, astounding when compared to the crash of 1929-1932 when the stock market “only” fell 75%. The fall in asset prices was less dramatic for real estate, but there was a similar trend.
What happened after 1982? Real estate prices did very well. The run up from 1982 to 2008 was basically continuous, with only short setbacks in 1986, 1992, and 2001.
Some people bought houses in places like New York City, in 1982, for as little as $20,000. By 2007 these houses were worth several million dollars.
If you were born in 1952 then you were 30 years old when real estate was reaching a historic low point. By contrast, if you were born in 1982, then your whole life has witnessed an economic story of concentration, escalation, and increasing unaffordability. So if you were born in 1952, you were given an incredible gift, simply by the luck of the year you were born. And if you were born after 1982 then… well, then you are less lucky.
Everyone should remember this rule: a nation can have housing that is affordable or it can have housing that offers great returns as an investment but it can never have both affordability and great investment returns.
The USA had affordability before 1982 and its had great investment returns since.
A nation that deliberately favors rising asset prices, even in housing, is a nation that would naturally follow policies that intensify a housing a shortage, since the shortage would drive prices higher. Is this sustainable? A whole generation gets priced out of a normal adult life. Do we want this? Should we want this to continue for multiple generations? Should we simply make adulthood illegal for future generations?
In the early to mid 20th Century strong labor unions helped drive up wages, especially after 1935. Higher wages meant the average worker could buy an automobile, which allowed longer commutes from work to home, which helped open vast tracts of farmland for development. No homes were built during World War II so by 1945 the nation was facing a housing crisis, but after that the government encouraged home building, and the next 13 years saw a dramatic change.
1958 was the peak year for the ratio of average wage to average rent. The average worker only paid 22% of their income in rent that year. And, no coincidence, this was the peak year of the Baby Boom. This was the easiest time in history when an 18 year old male could get married, find a good place to live, and start a family. The affluence was widely shared: both whites and blacks participated in this affluence. In fact, the first half of the New Deal was the only time in USA history when blacks enjoyed wages that rose faster than whites.
By the early 1960s a prosperous and confident middle class was enjoying the easiest era of home buying in history. My own parents benefited. In 1964 they bought a 2 story house (2,400 square feet / 223 square meters) in New Jersey for $19,500. My dad made $12,000 a year as a lab assistant, and my mom made $5,000 as a school teacher, so the house cost just a bit more than what they made together as two young people both trying to start their careers.
What is meant by the phrase “the standard of living?” We know it is complex and multi-variate. We all know it peaked in the mid to late 20th Century. But if we focus on specific aspects of it, we see that each constituent part of the trend peaked at a different moment.
The median male wage peaked in 1973. Household income peaked in 1999. Where did households get the extra 26 years of income growth? That’s simple: women went out and got jobs. Male wages were stagnant but women started working, so family income continued to rise even though men were struggling.
Let's focus on facts. Look at this chart from FRED. It shows family income in the USA.
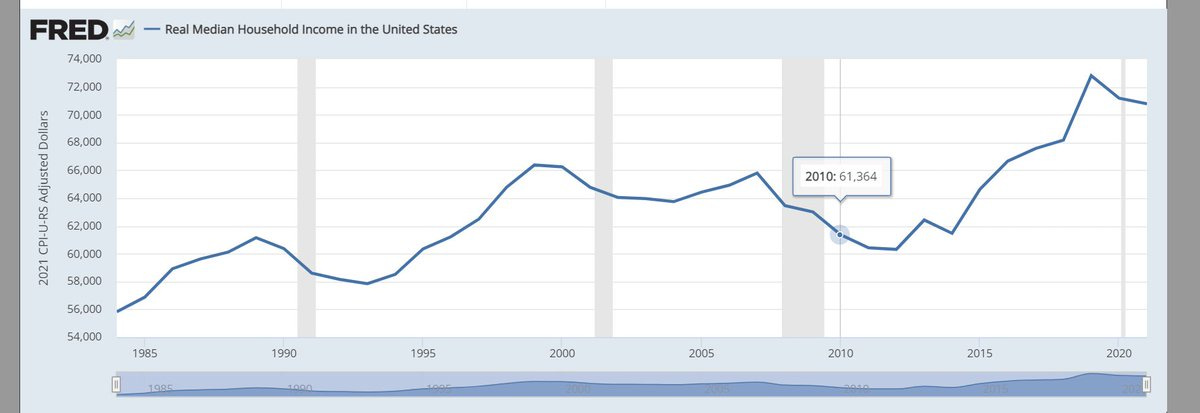
Family income stagnated from 1999 to 2018, the longest stagnation in USA history, longer even than the Great Depression. And this long stagnation created the frustrations that gave us President Trump, and which unleashed the dark and hateful forces of fascism.
While family income began to improve after 2014, it took 4 more years just to get back to where it had been in 1999. And when you add in the fact that crime has been trending up since 2016 and health inflation has been rising at an unsustainable rate that will bankrupt the country unless something is done (and nothing is getting done about this) then a strong case can be made for pessimism about the journey the USA has traveled over the last 25 years. Going forward, optimism might be warranted if family income can repeat the growth spurt it saw 2014-2019, but if we lapse back into stagnation, then extreme pessimism about the future is the only rational view point.
(As a side note, it is surprising that the era of the Internet was such a terrible time for family income. Economists in the 1990s predicted that the Internet would create an economic boom, but instead the first 20 years of widespread Internet use was a difficult time for family income. This suggests that technology cannot save us. Our problems are political, and the solutions must be political.)
Again, what is meant by the phrase “the standard of living?” We know it is complex and multi-variate. Another aspect to look at is taxes, which have been cut for the wealthy, but which have increased for the middle classes.
Taxes peaked 1936 to 1962 at 91% for income above $100,000. Adjusting for inflation, that’s about $1.8 million today.
Then it was a bumpy ride but the trend was down till the 1990s:
Small tax cut in 1962.
Big tax break in 1964, top rate falls to 70%.
Big cut in 1982, top rate down to 28%.
Small increase in 1991.
Medium increase in 1993, top rate up to 39%.
Cut in 2003, pushed by President Bush.
Medium increase in 2010 as part of Obamacare.
Cut in 2018, pushed by President Trump.
These are the top-line, formal numbers. In the middle, and informally, the wealthy have been offered more and more loopholes, and enforcement has weakened.
What is the result?
In 1960 the Federal budget was equivalent to 14% of the USA’s GDP and at that time the wealthy were paying 91% on their top income.
By contrast, in 2022 the Federal budget was equivalent to 27% of the USA’s GDP and the wealthy paid less than 20% of their income, after all exemptions.
So who is paying for the big increase in the Federal budget that happened between 1960 and 2022? That would be the middle classes.
Again, what is meant by the phrase “the standard of living?” We know it is complex and multi-variate. How do we integrate all of these trends into a coherent picture?
When we talk about the decline in the standard of living, these are the crucial turning points:
ratio of wage to rent reaches its happy peak in 1958
male wage peaks in 1973
family income peaks in 1999
asset prices hit bottom in 1982, and then rise relentlessly. If you already own an asset, like a home, then you are one of history’s luckiest winners. But if you don’t own an asset in 1982, becoming an asset-owner becomes more and more difficult, with each year after 1982.
taxes for the wealthy decline after 1962
taxes for the middle class rise after 1982
Put it all together: the American standard of living peaked in the mid to late 20th Century, depending on which variable you consider the most important. The standard of living has been in decline from 1973 or 1982 or 1999, depending on which numbers you want to use.
What to do?
If we are ever again going to have a broad and confident middle class, we can all see which policies need to change. For instance, regarding taxes, we want to go back to the 1950s, so that the middle class pays less and the wealthy pay more.
We want wages to rise. How can that be done? In the past, it was done thanks to labor unions. And going forward, that has to be one of the main answers. The workers have to be encouraged to form organizations that can advocate for workers. All kinds of organizations should be encouraged, both those specific to a company and also those who focus on national labor policies.
Sometimes the government can rely on private sector businesses to build enough housing for the public. Sadly, this tactic has not worked since 2008. We may be facing a “capital strike” meaning investors are refusing to invest enough to give the public what the public needs. This leads to a much broader conversation.
When private sector businesses fail to provide the public with what the public wants, then the government has to step in. And for the government to step in, we need to build up the institutions that translate a policy from an idea into a reality. So then the conversation needs to focus on building institutions.
In the early to mid 20th Century the USA invented many new forms of government, and we lead the world in the invention of new kinds of institutions. If we want to restore the prosperity we once had, and if we want to go beyond that and reach new levels of prosperity, and if we want to balance that prosperity against concerns about the environment, then we will need new kinds of institutions.
What will those new institutions look like? That is a very big topic, but I offered the start of an answer in “In our highly specialized and complex world, all real political power needs to move to specialized committees.”